Visualising Covid-19 data

Covid-19 as you will know has gripped the whole world. It has been classified as a pandemic by the WHO. I am no expert on the disease itself and do not have any expertise on policy making, it would be unwise for me to comment on the actions taken by all the different governments from around the world.

My interest in this is very academic and data driven. The numbers which are changing daily are used to chart the progress of the disease as well as study the impact of the various measures taken to counteract the spread of the virus.

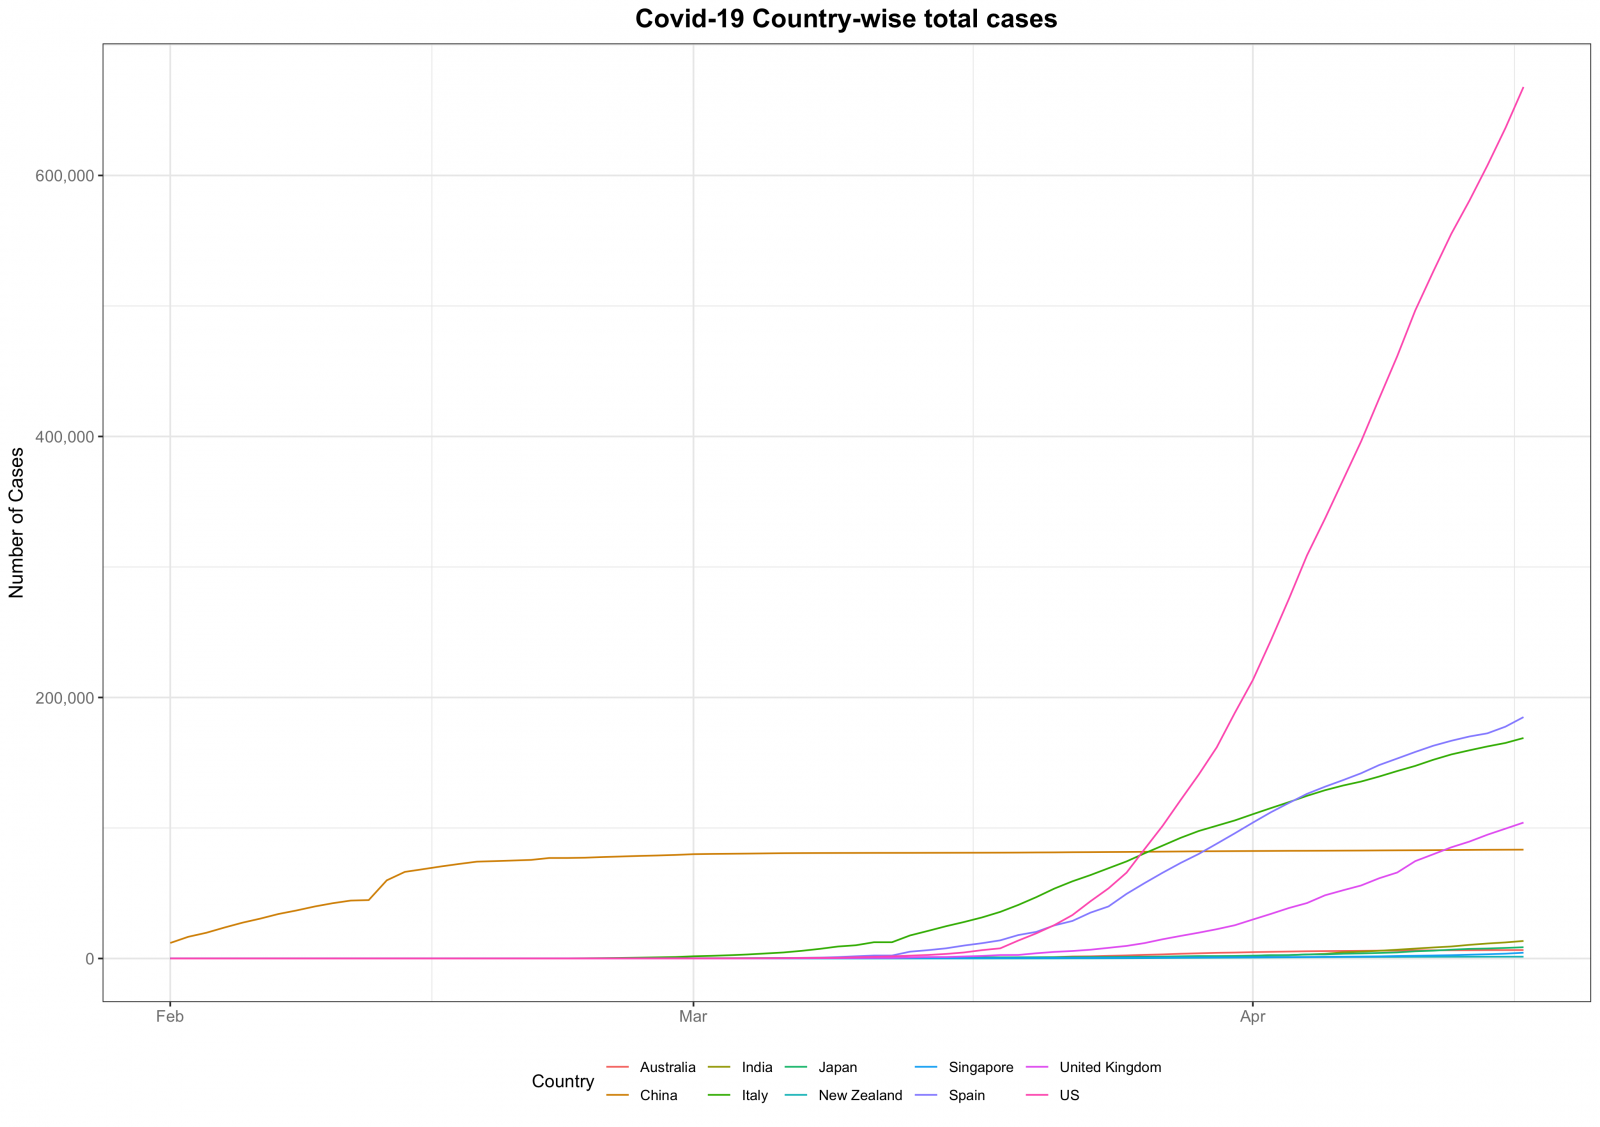
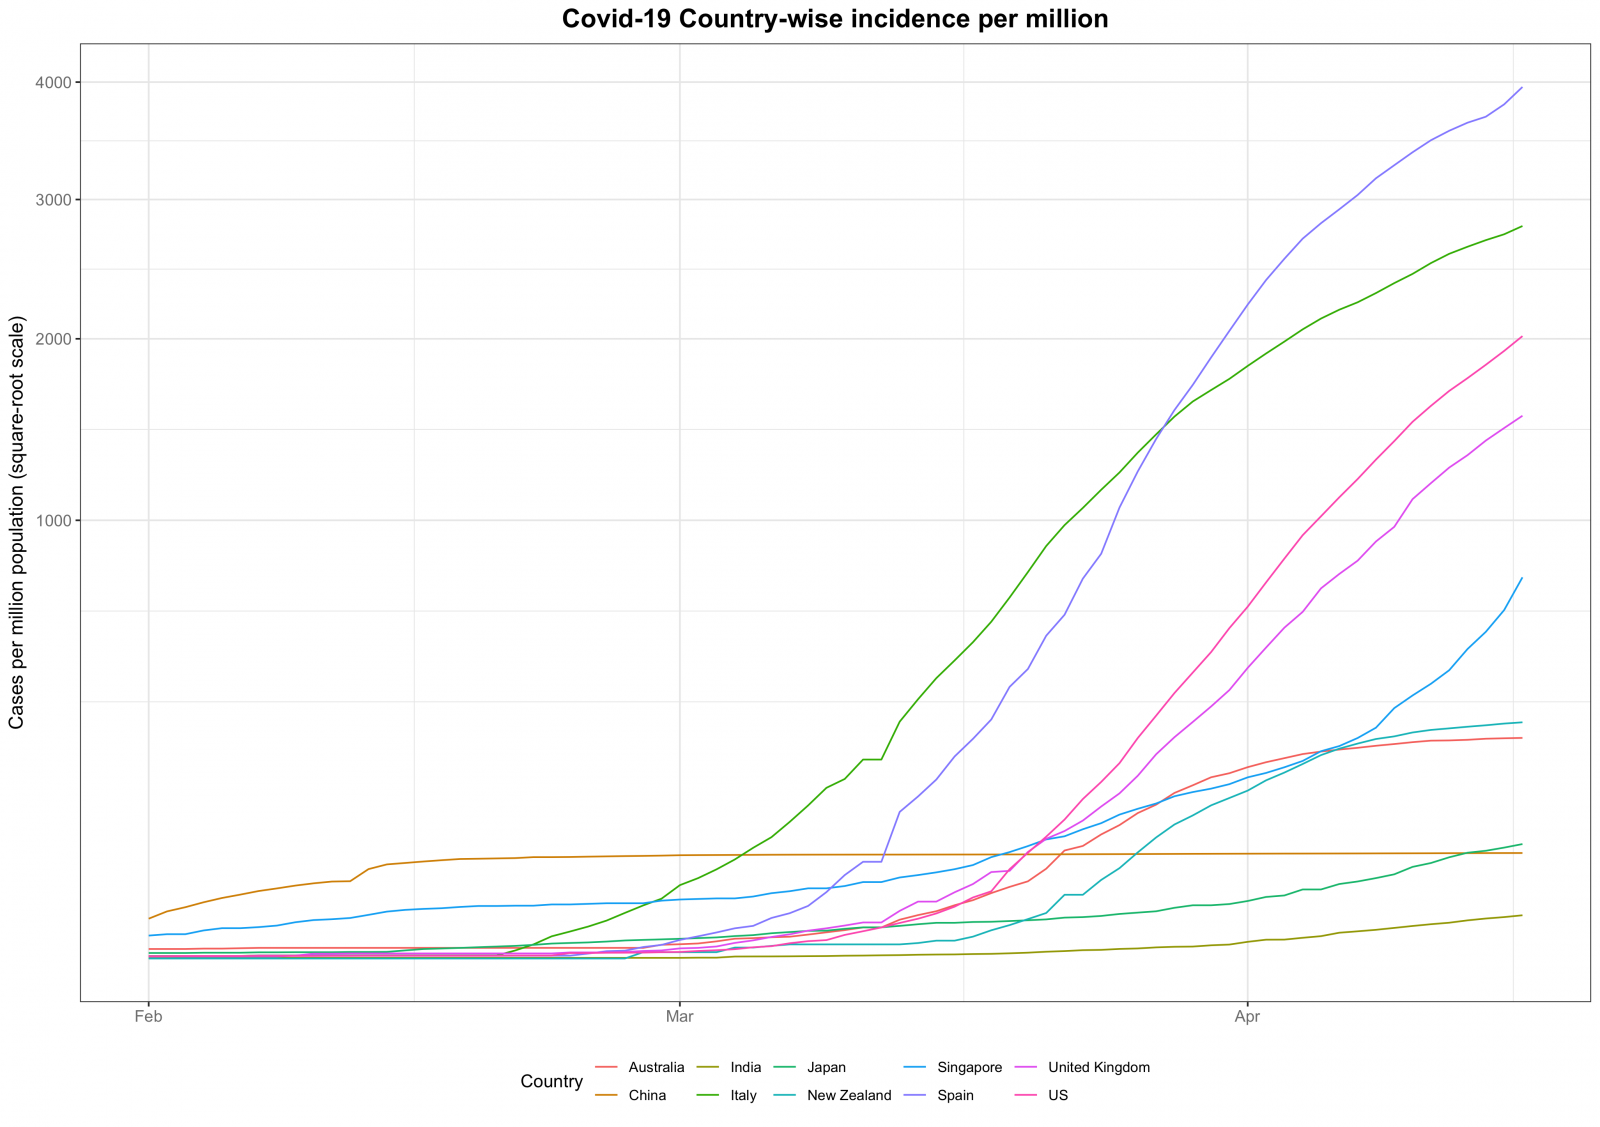
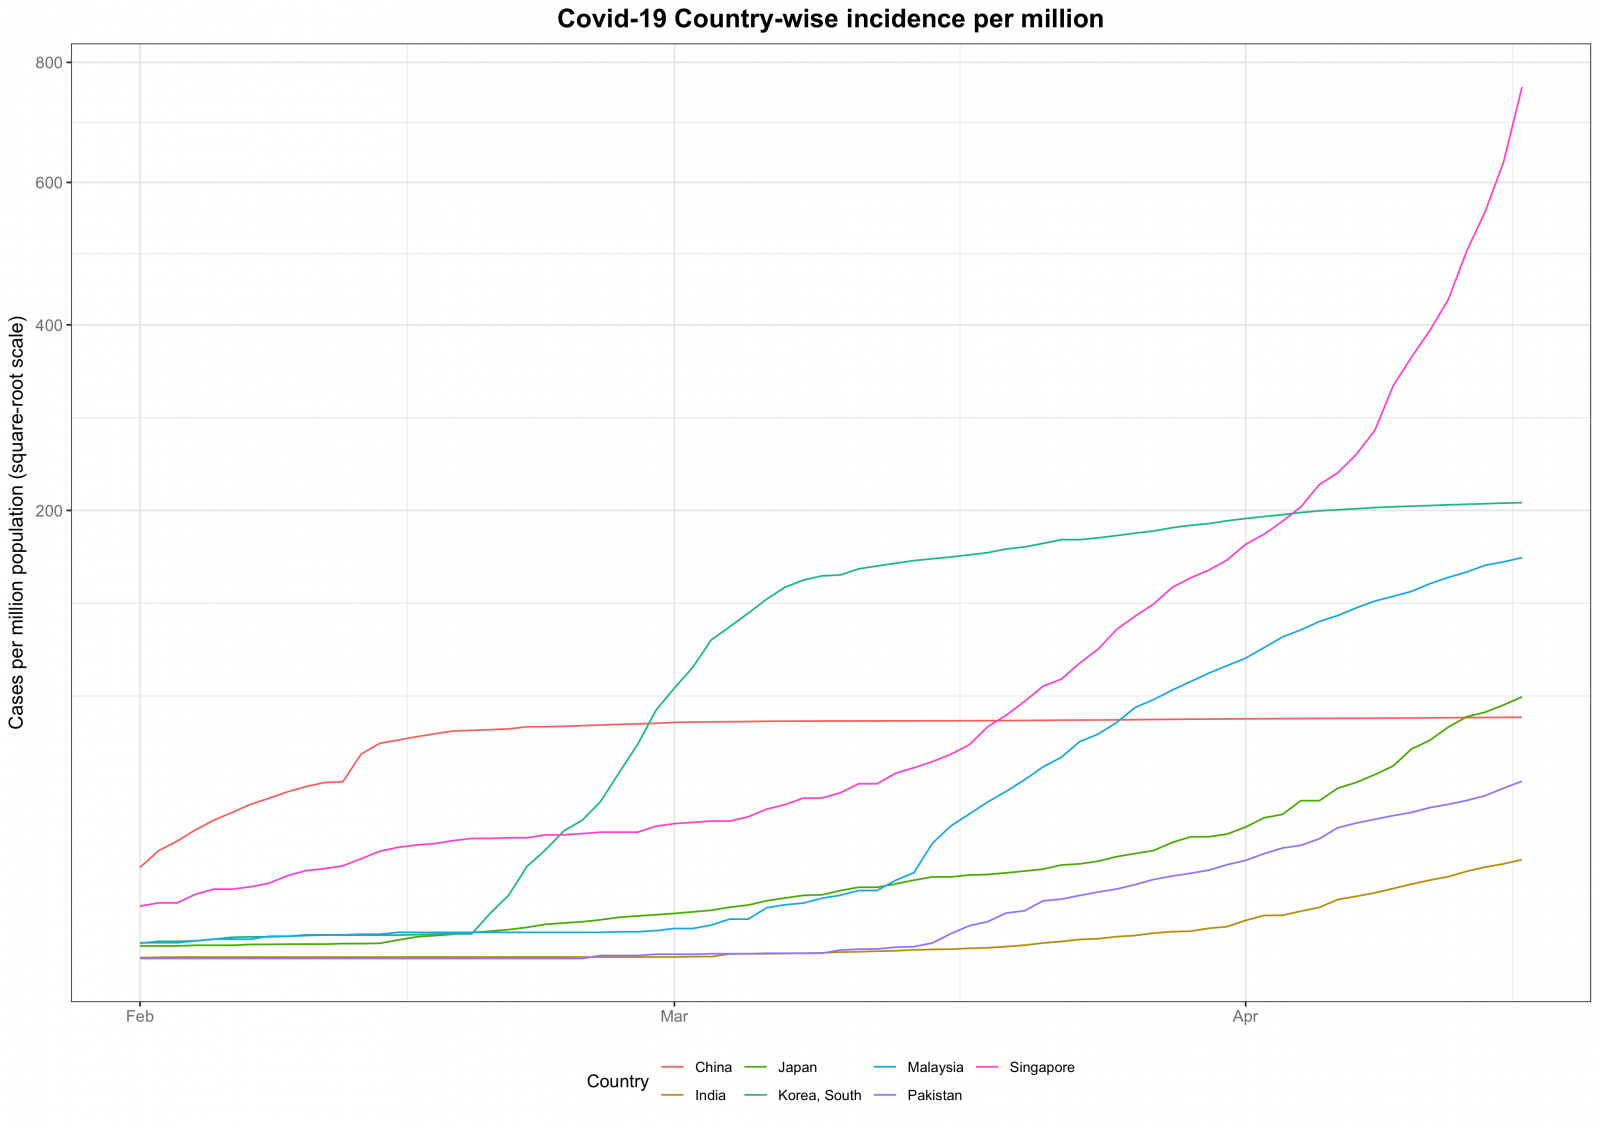
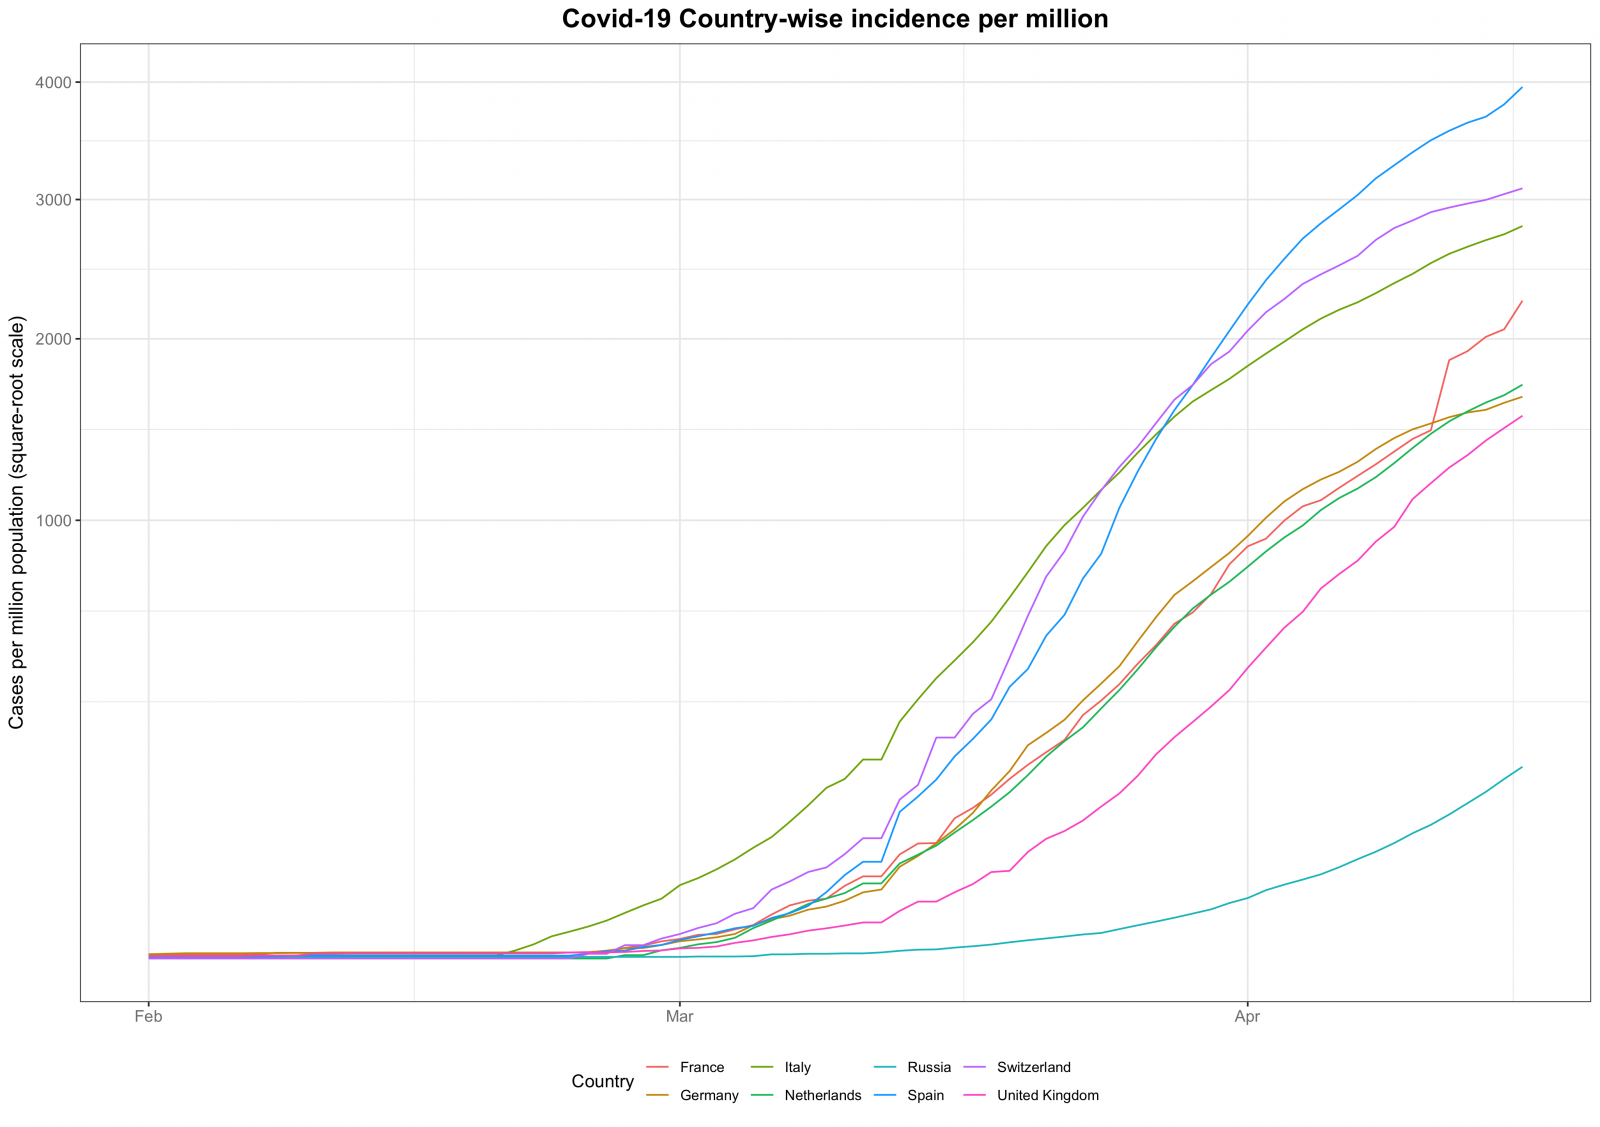
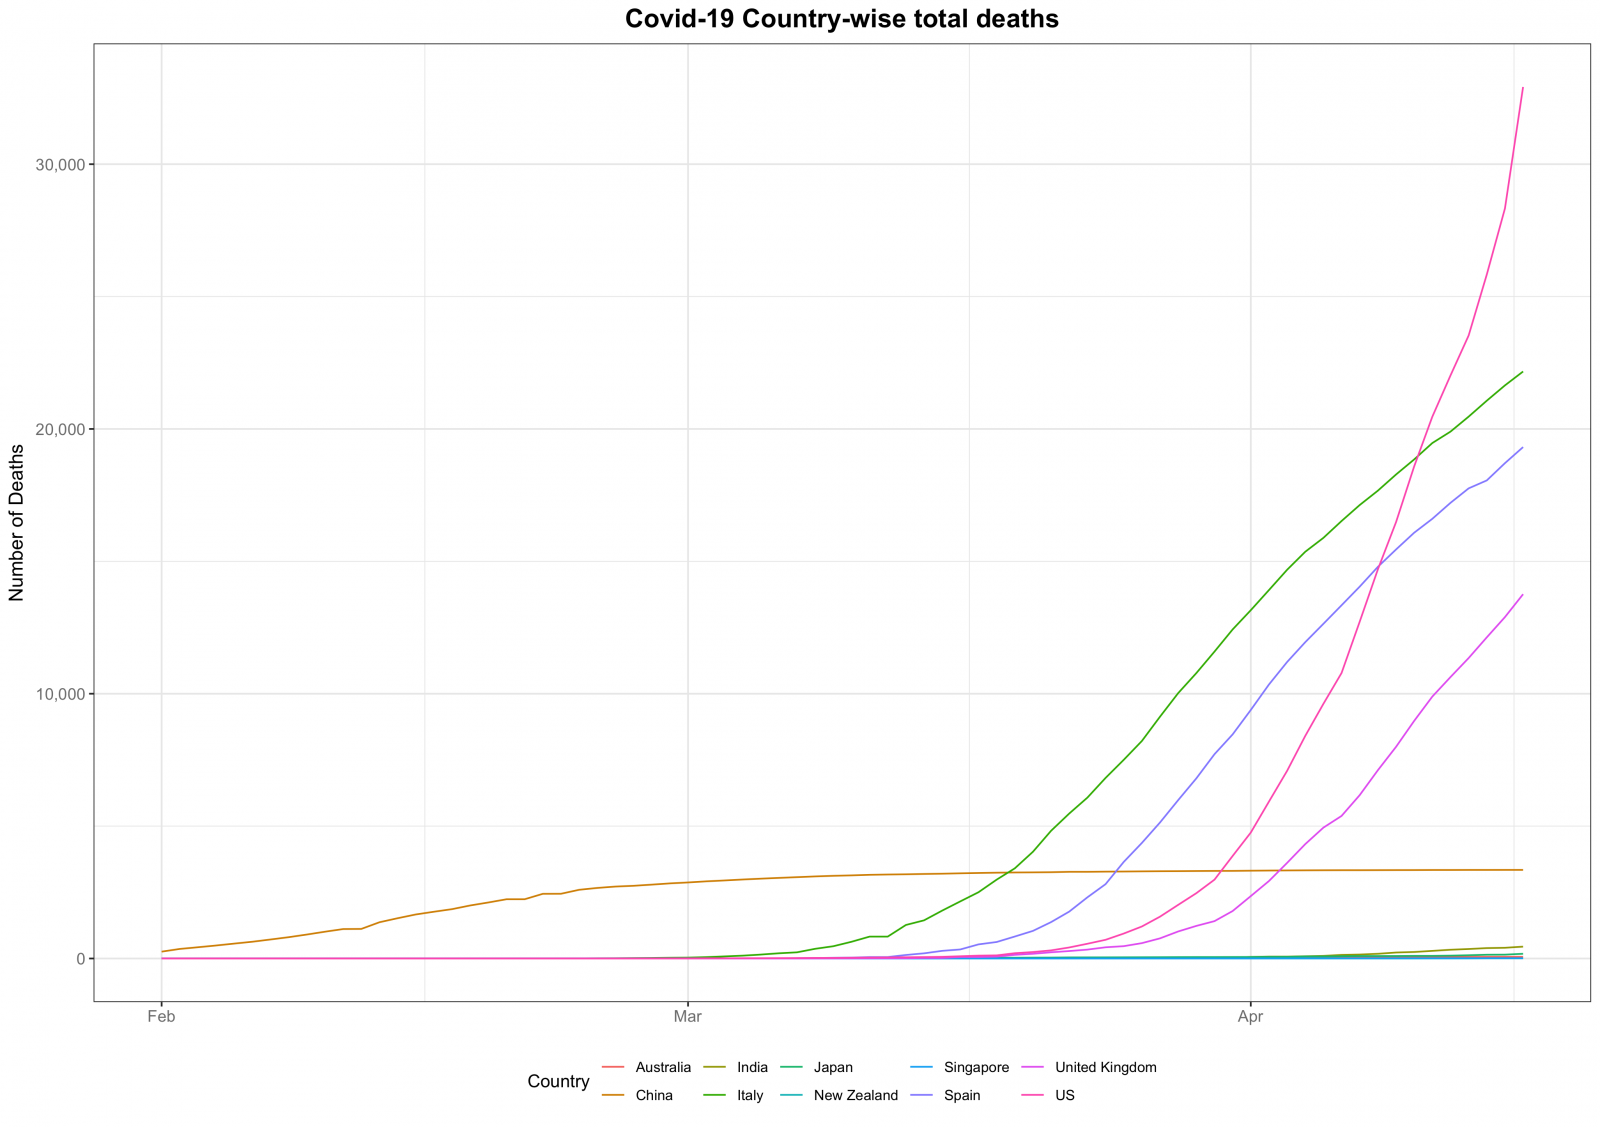
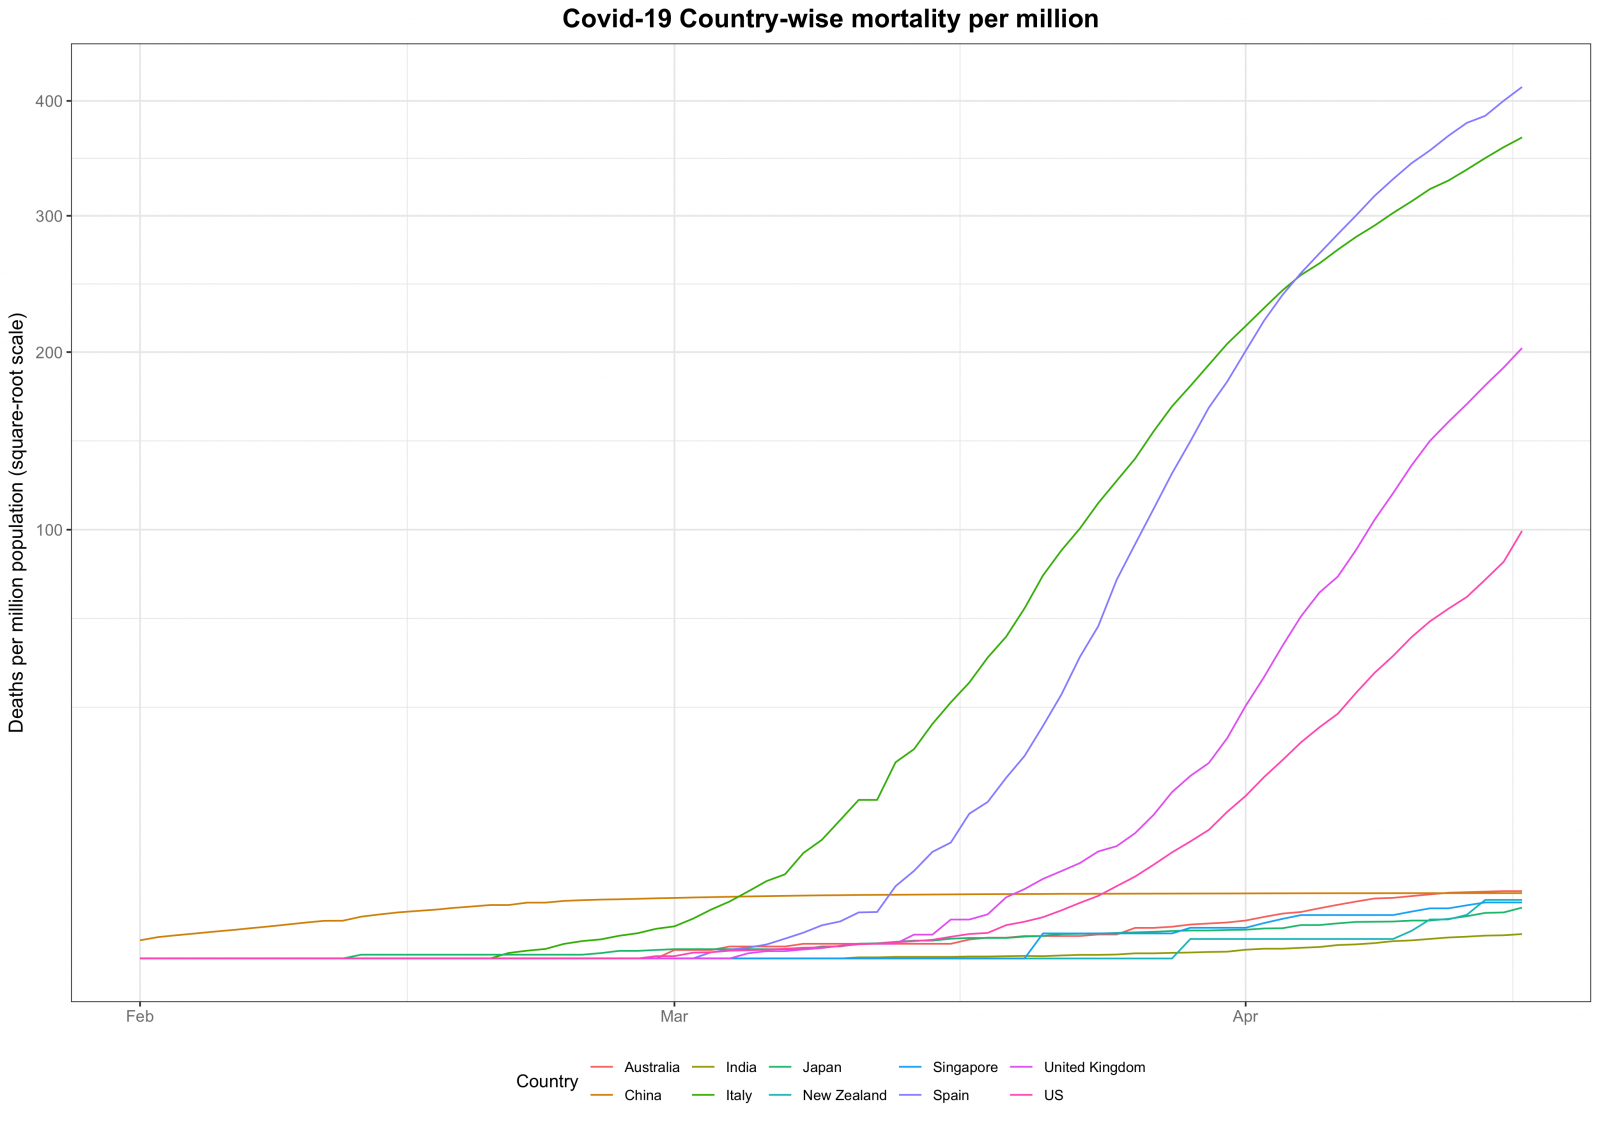
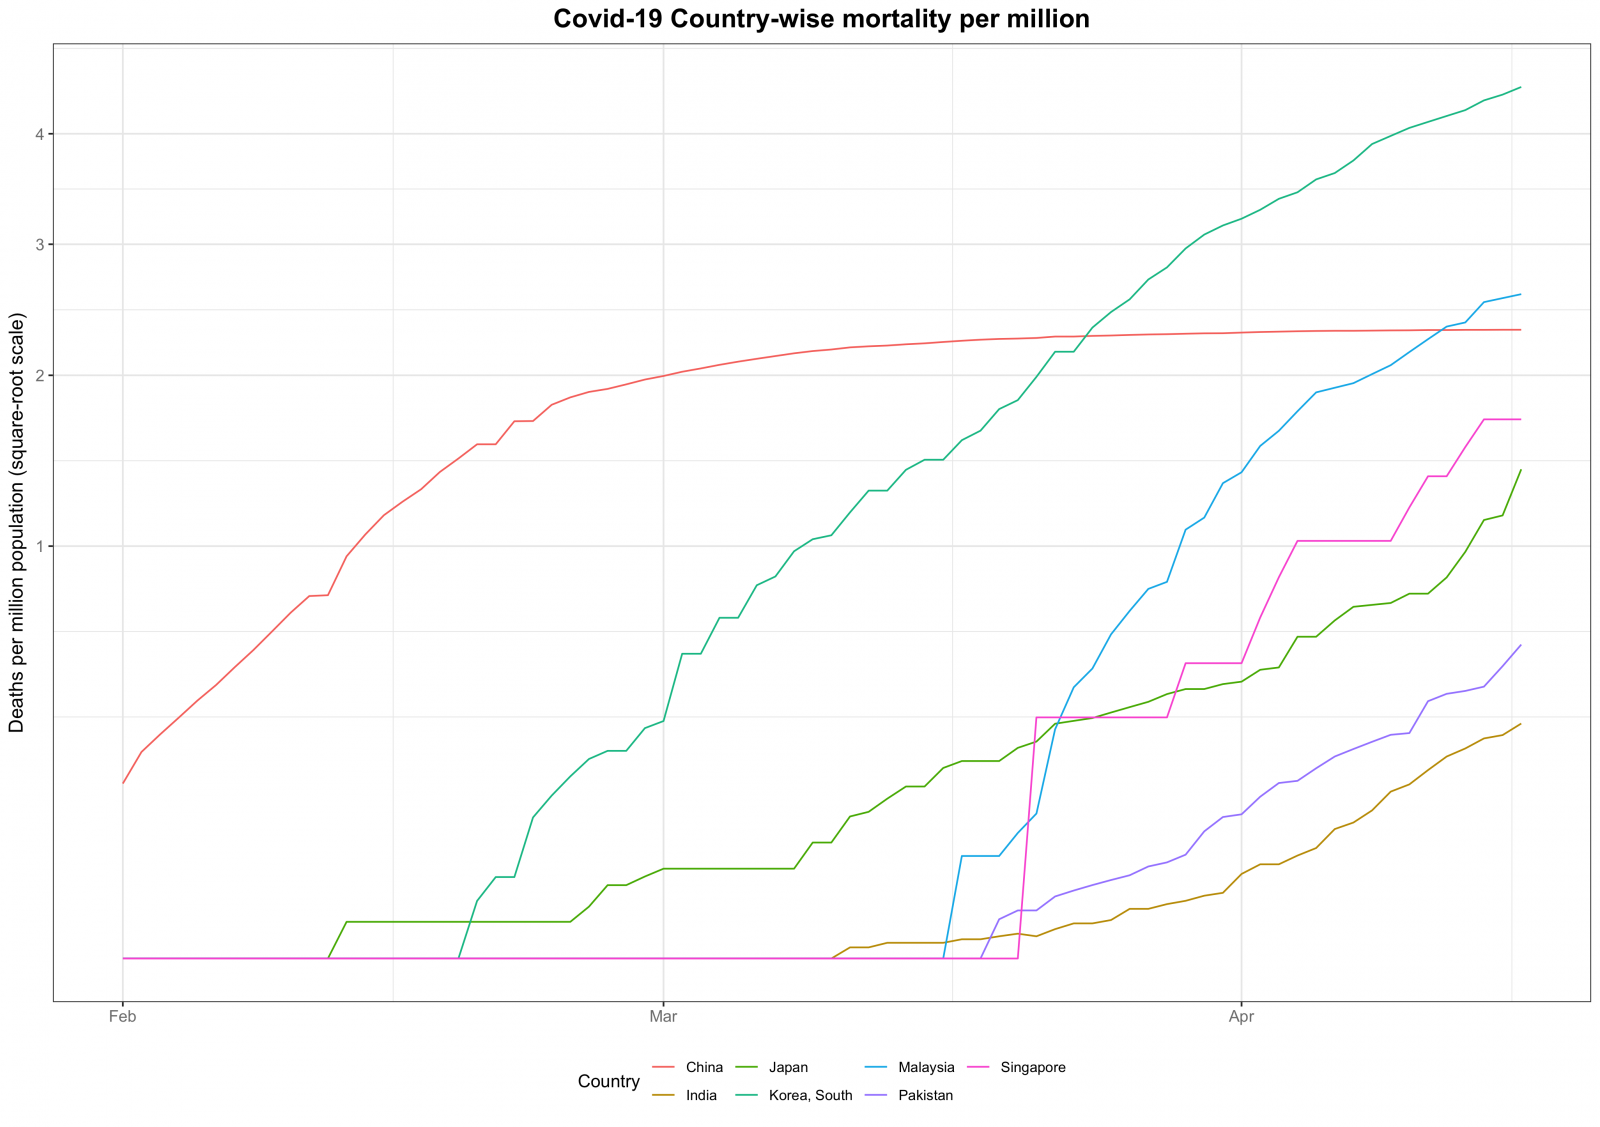
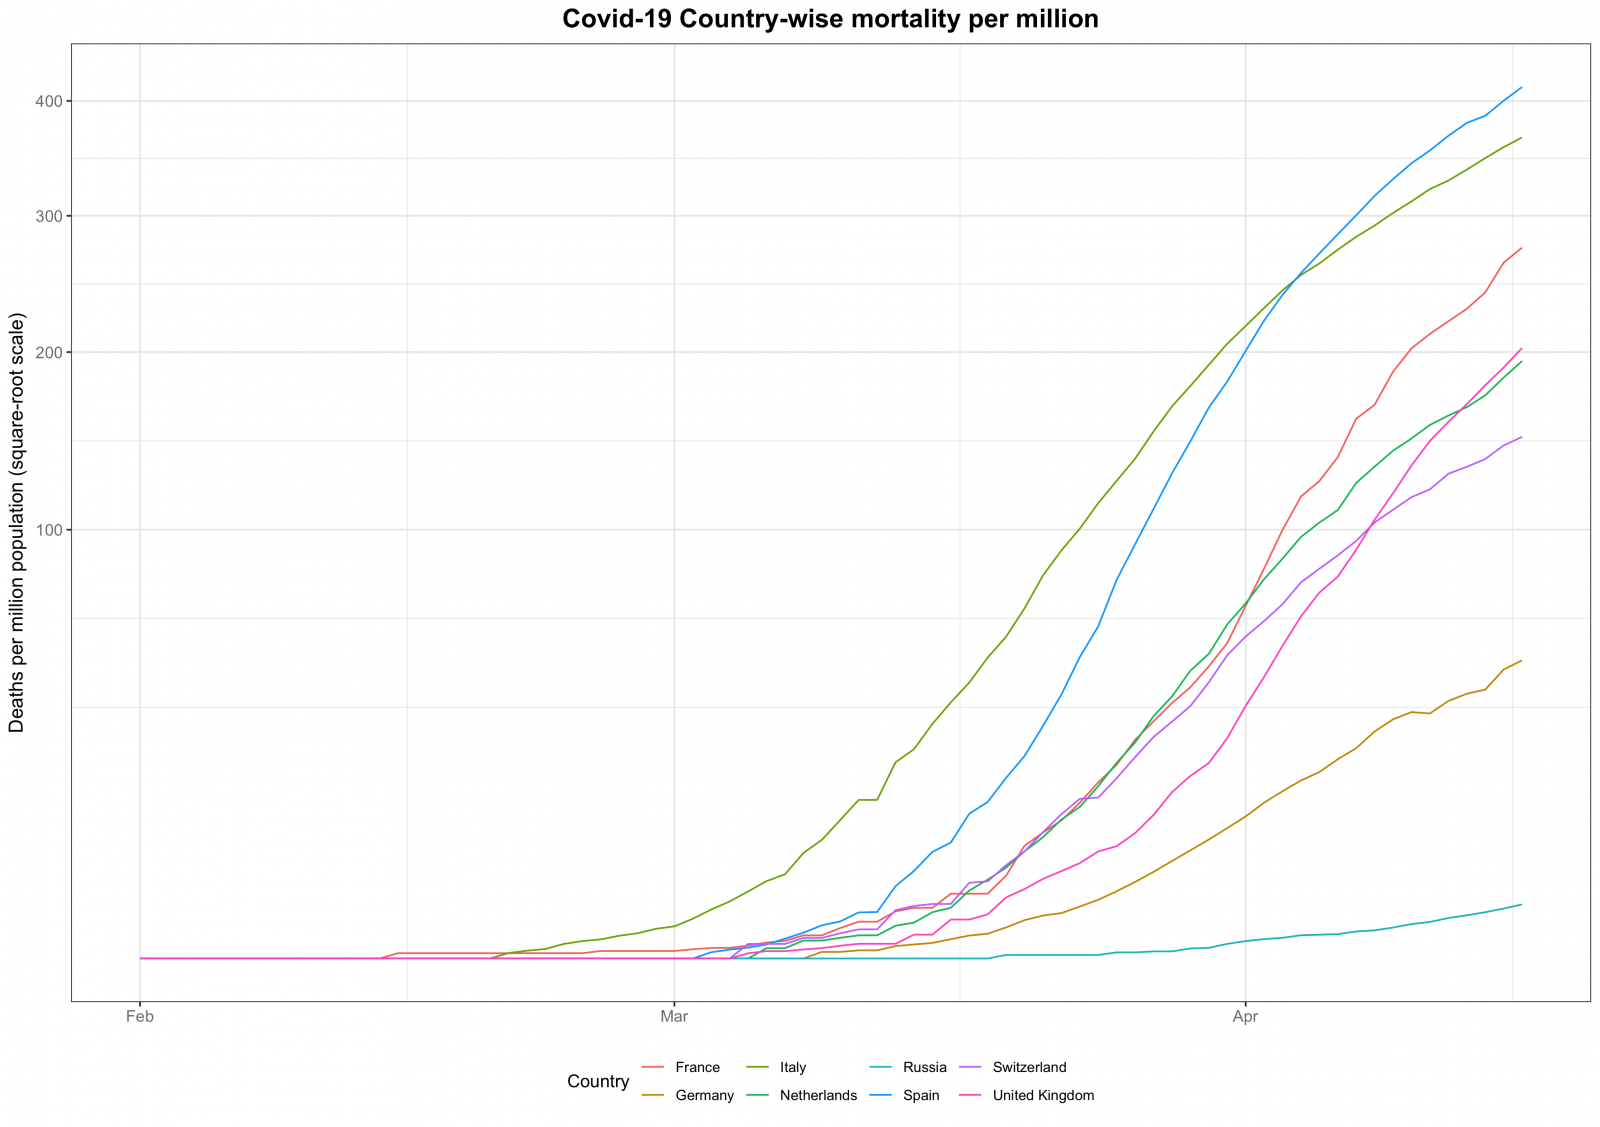
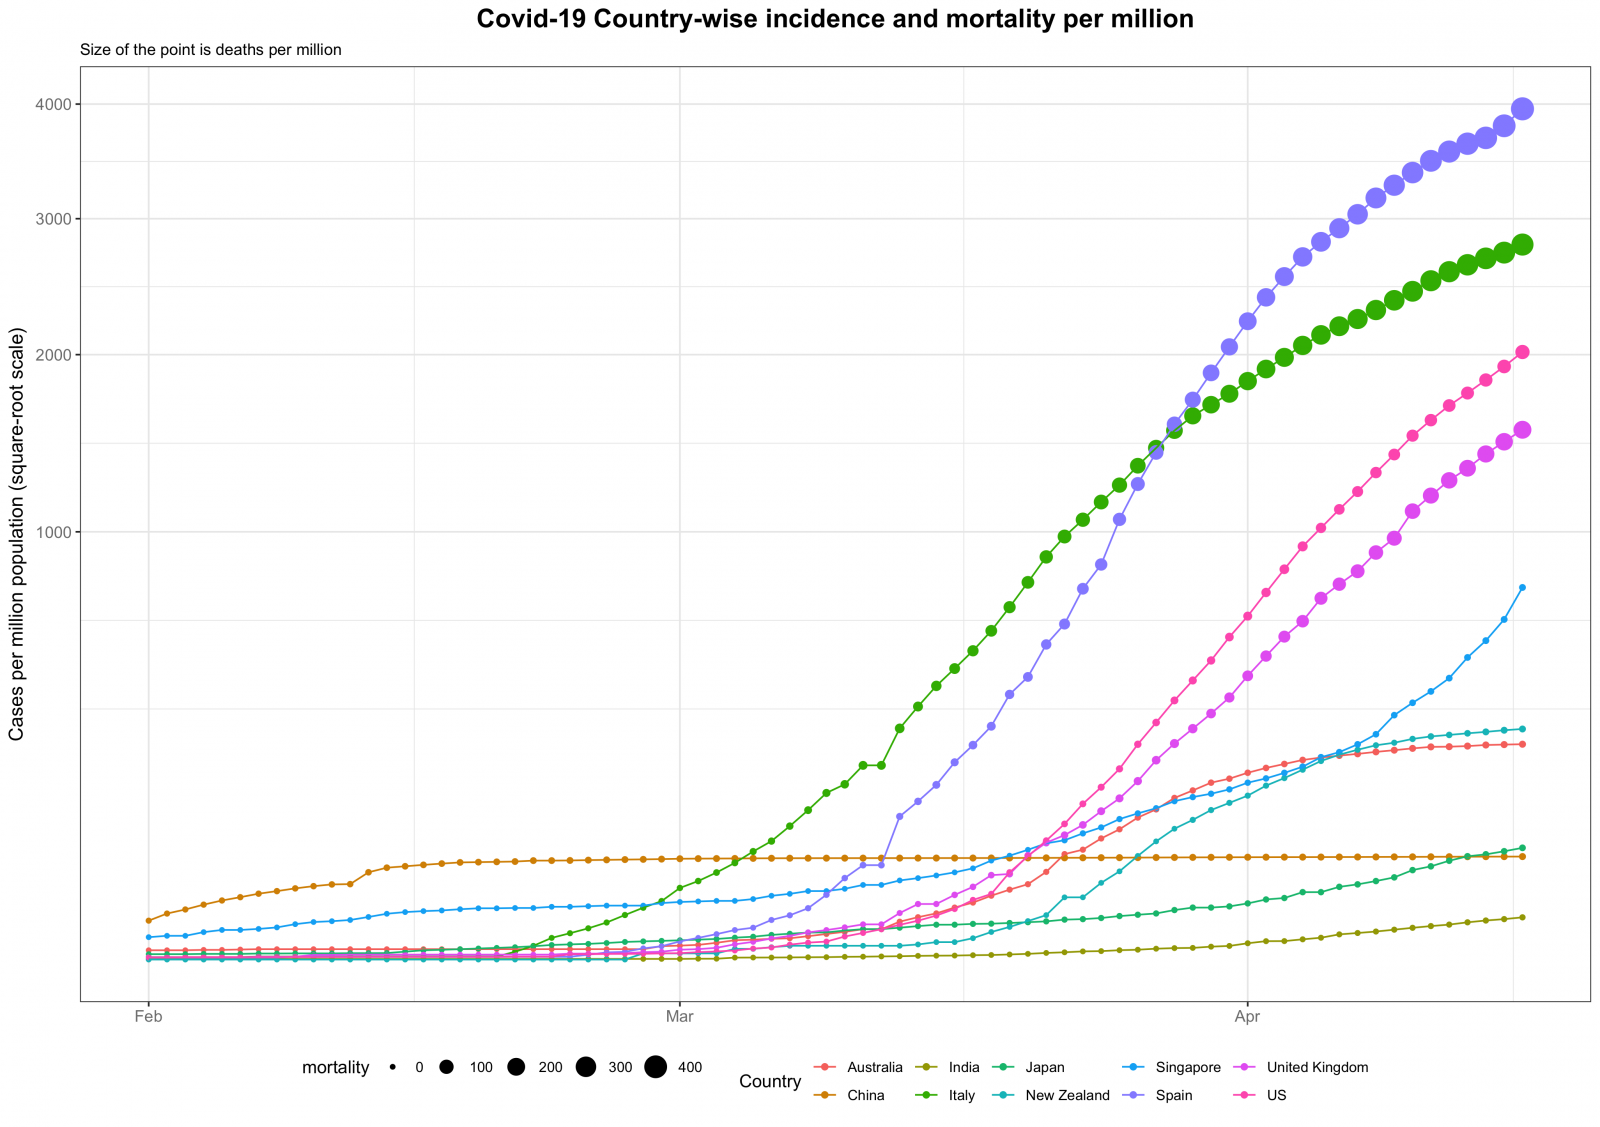
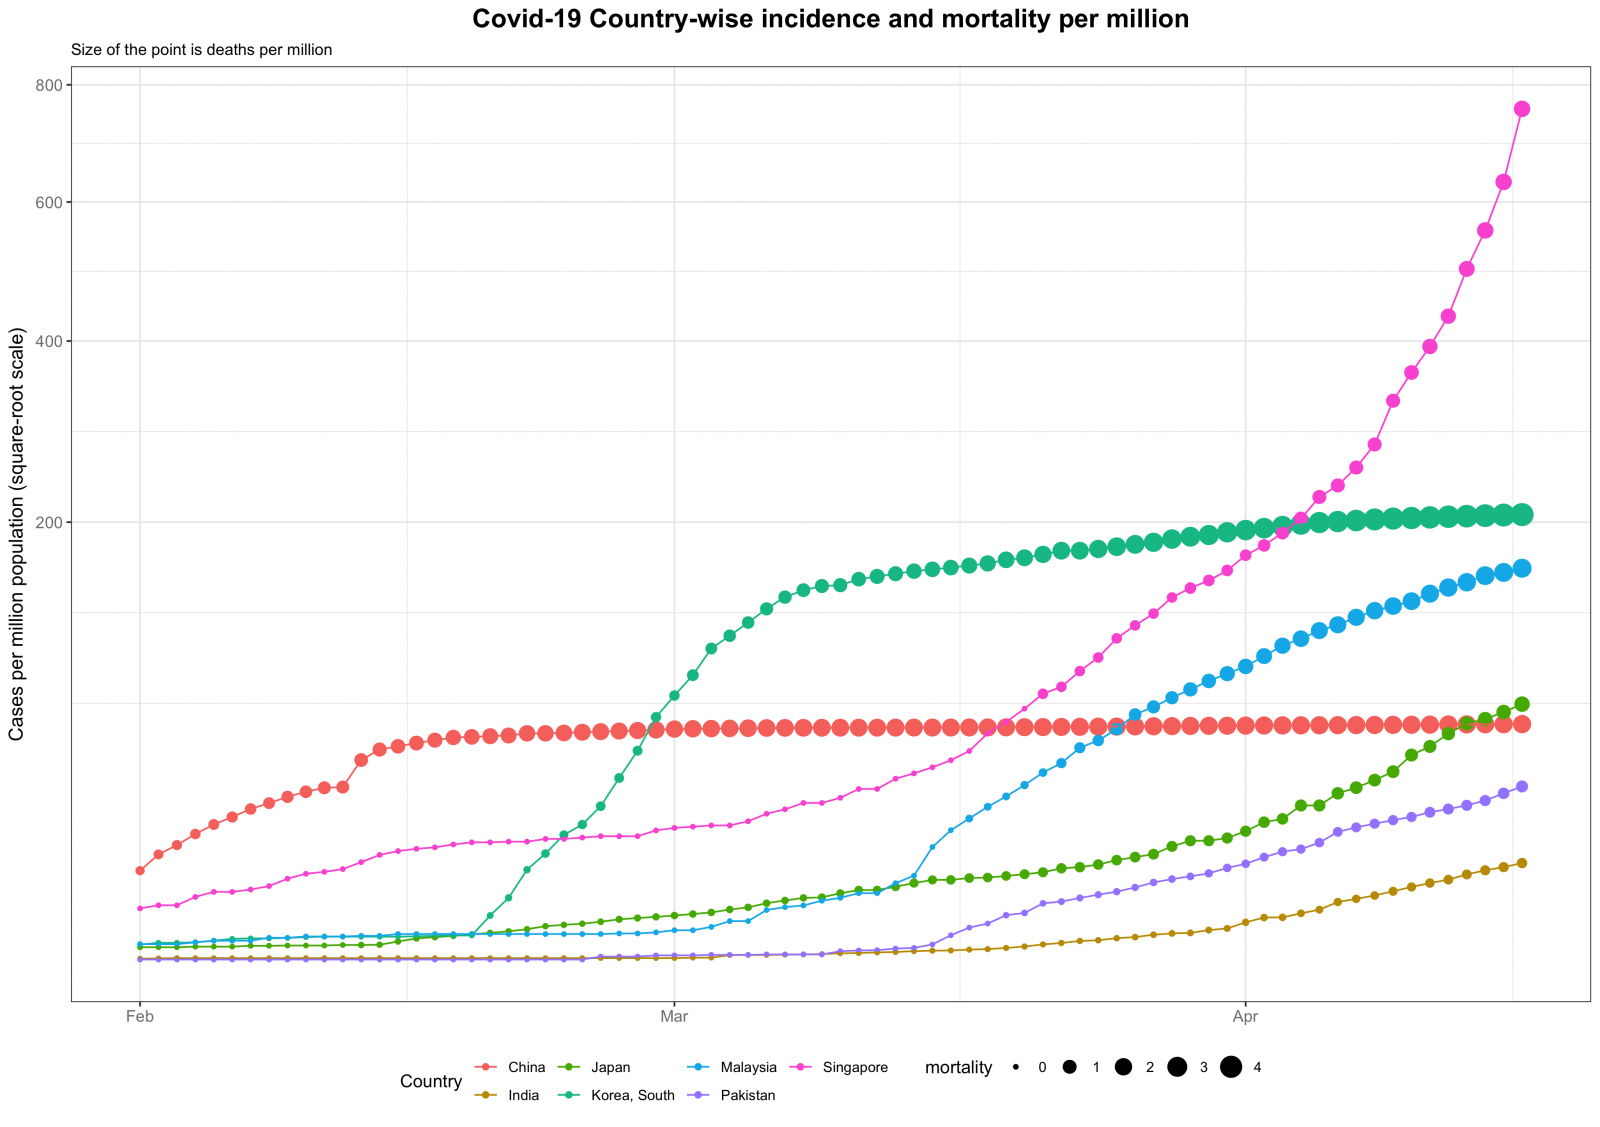
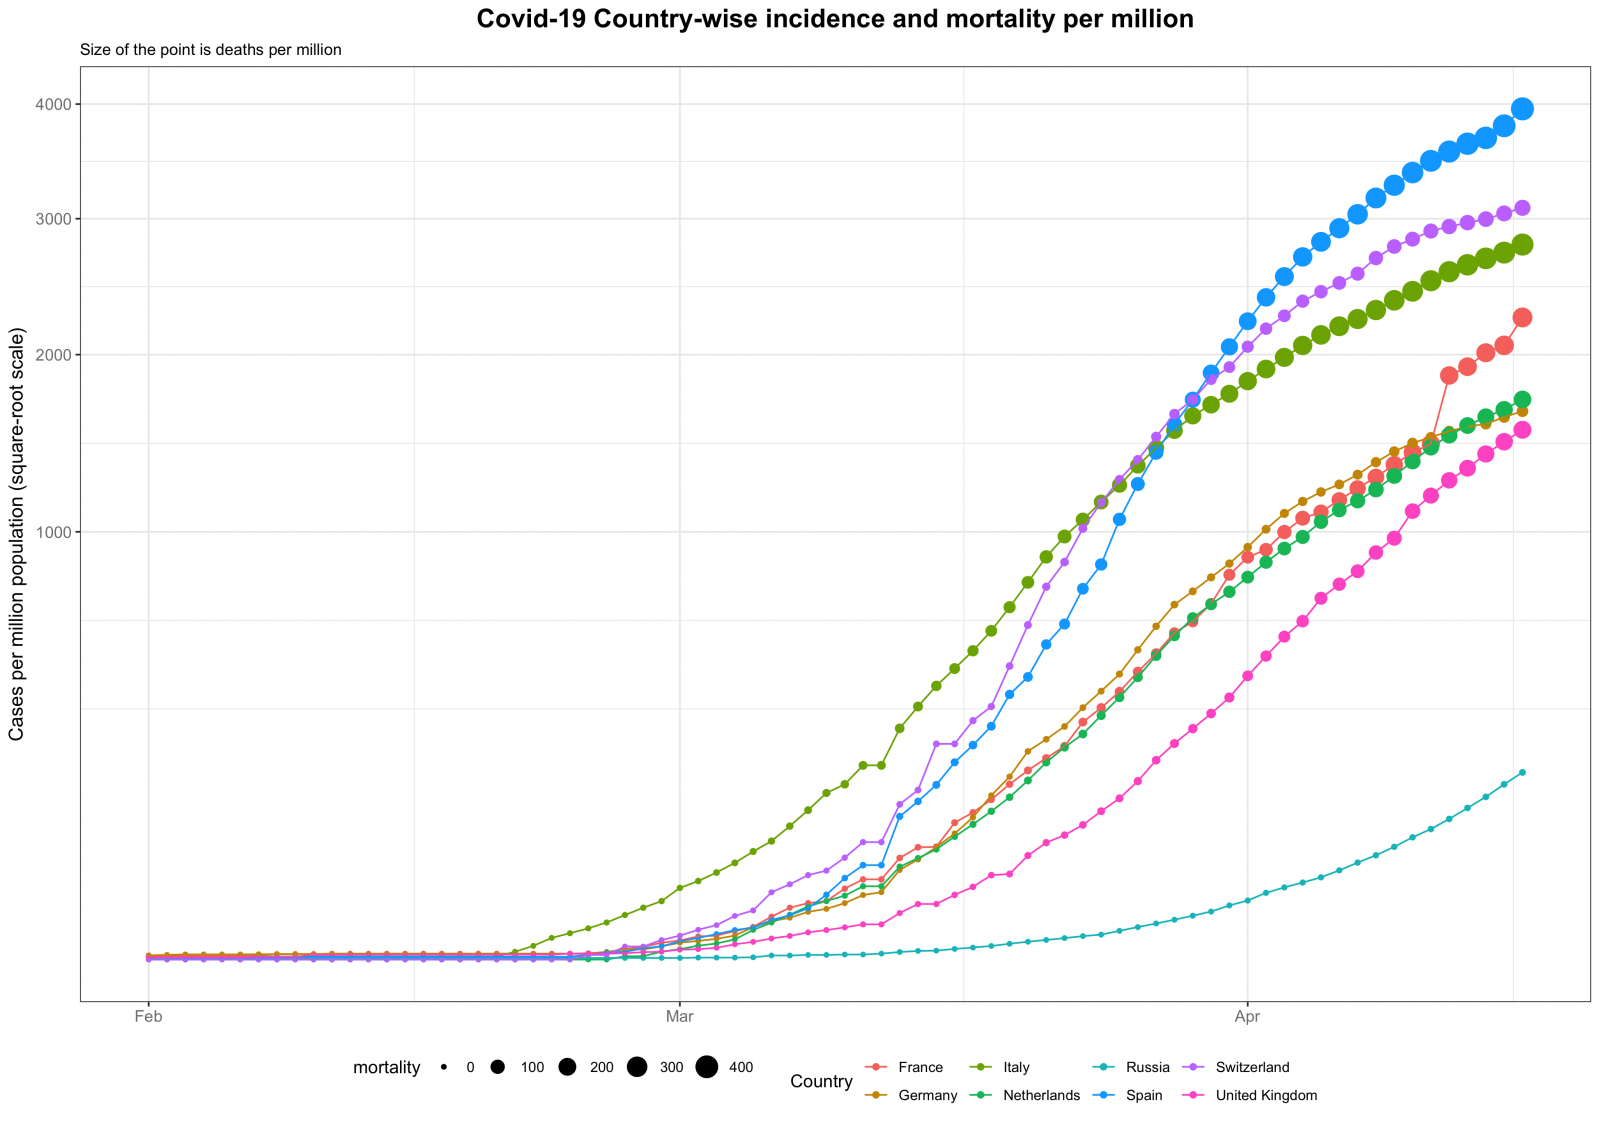
Over the past few weeks, a lot of data has been used to produce graphics which can communicate effectively the information pertaining to this pandemic. Of most relevance I think are the number of confirmed cases and the deaths due to coronavirus stratified by country. Most of these graphics have focused on the raw numbers. Although the raw number is useful it nonetheless is incomplete. I think a better measure is to adjust the raw number by the population of the country. This provides a better measure as to how severe the effect of the virus has been on a country.

Keeping that in mind I produced some graphs for population-adjusted confirmed cases and deaths for some select countries. I plan to update these graphs on a regular basis over the coming weeks to understand the spread of this disease. All plots start on 1 February 2020 and end on the latest date for which I have the data. All data has been sourced from the Johns Hopkins University Center for Systems Science and Engineering (JHU CSSE)a.

Further subdividing the population into gender and age subgroups can provide more nuanced information. A good source for such informative graphics and the related analysisb can be found here.

References
a JHU CSSE Covid-19 Github Data Repository: link
b Max Roser, Hannah Ritchie, Esteban Ortiz-Ospina and Joe Hasell (2020) – “Coronavirus Disease (COVID-19) – Statistics and Research”. Published online at OurWorldInData.org. Retrieved from: ‘https://ourworldindata.org/coronavirus’ [Online Resource]

Visualising data

Data visualisation is an essential tool for a statistician or for that matter, any individual user of statistics. It is used to visualise the data being analysed before more rigorous analysis techniques are applied. Or, once the analysis is complete, it can be used as a medium of relaying the results. Visual aids are quite powerful in not only communicating information but also teasing out details from the data.

I learnt a lot regarding good graphics from one of my favourite lecturers at ANU. Another great source for understanding the power of graphics was the many books written and published by Edward Tufte. Anyone in the field of data visualisation would have heard of Tufte. His 1983 book, The Visual Display of Quantitative Information, which has now been reprinted so many times has been a most invaluable source for my learning.

A good graphic will portray relevant information and be self-explanatory. If you feel that you need to provide too much explanation for your graphic, then you might need to reconsider the graphic you have chosen. I think that it is always better to have a simple graph. It is tempting to make an elaborate looking graph which may even be complicated to produce but more often than not, fails to communicate the information.

If you are ever thinking of producing a picture to portray information then I suggest you follow Tufte’s principles of graphical excellence and integrity as outlined in his book mentioned above. To begin with, what a graphical display should do:

  1. Show the data.
  2. The viewer should be able to make inference regarding the data.
  3. Avoid distorting the data.
  4. Make comparisons of different pieces of data easy.
  5. Reveal several levels of detail.
  6. Serve a reasonably clear purpose: description, exploration, tabulation, or decoration.
  7. Be closely integrated with the statistical and verbal descriptions of a data set.

Tufte’s Principles of Graphical Excellence

  • Graphical excellence is the well-designed presentation of interesting data—a matter of substance, of statistics, and of design.
  • Graphical excellence consists of complex ideas communicated with clarity, precision and efficiency.
  • Graphical excellence is that which gives to the viewer the greatest number of ideas in the shortest time with the least ink in the smallest space.
  • Graphical excellence is nearly always multivariate.
  • And graphical excellence requires telling the truth.

Principles of Graphical Integrity

  • The representation of numbers as physically measured on the surface of the graphic itself should be directly proportional to the numerical quantities represented.
  • Clear, detailed and thorough labelling should be used to defeat graphical distortion and ambiguity. Write out explanations of the data on the graphic itself. Label important events in the data.
  • Show data variation, not design variation.
  • In time-series displays of money, deflated and standardized units of monetary measurement are nearly always better than nominal units.
  • The number of information-carrying (variable) dimensions depicted should not exceed the number of dimensions in the data.
  • Graphics must not quote data out of context.
  • Be aware of the Lie Factor, which is a ratio: (Size of the effect shown in graphic)/(size of the effect in data)

My research publications

My current publications are primarily from my collaboration in the medical field of electrophysiology. My first paper was published back in 2014 and then a few more in the following years.

  • Pathak, R, Middeldorp, M, Lau, D et al 2014, ‘Aggressive Risk Factor Reduction Study for Atrial Fibrillation and Implications for the Outcome of Ablation’, Journal of the American College of Cardiology, vol. 64, no. 21, pp. 2222-2231.
  • Pathak, R, Elliott, A, Middeldorp, M et al 2015, ‘Impact of CARDIOrespiratory FITness on Arrhythmia Recurrence in Obese Individuals With Atrial Fibrillation The CARDIO-FIT Study’, Journal of the American College of Cardiology, vol. 66, no. 9, pp. 985-996.
  • Pathak, R, Mehta, A, Lau, D et al 2015, ‘Reply: Going Over LEGACY With a Pinch of Salt’, Journal of the American College of Cardiology, vol. 66, no. 17, pp. 1946-1946.
  • Pathak, R, Middeldorp, M, Meredith, M et al 2015, ‘Long-Term Effect of Goal-Directed Weight Management in an Atrial Fibrillation Cohort A Long-Term Follow-Up Study (LEGACY)’, Journal of the American College of Cardiology, vol. 65, no. 20, pp. 2159-2169.
  • Pathak, R, Evans, M, Middeldorp, M et al 2017, ‘Cost-Effectiveness and Clinical Effectiveness of the Risk Factor Management Clinic in Atrial Fibrillation: The CENT Study’, Journal of the American College of Cardiology, vol. 3, no. 5, pp. 436-447.
  • Mehta, A & van Haren, F 2018, ‘Attitudes and self-reported end-of-life care of Australian and New Zealand intensive care doctors in the context of organ donation after circulatory death’, Anaesthesia and Intensive Care, vol. 46, no. 5, pp. 488-497.

Travelling diary

I thought about writing about the places I have visited and share the varied experiences I have had. But then, a picture is worth a thousand words. Here is a collection of images which show not just the places visited but give you a glimpse of each experience.

This slideshow requires JavaScript.

You can check out more of my photographs here.

My favourite portraits

Photography means different things to different people. For me, it is a way of capturing a moment such that it tells a story of its own. I have my own story for the photographs I take but I do not always expect my audience to comprehend that story. I would rather prefer that the image compels them to come up with their own story. Maybe it reminds them of something, or maybe it allows them to let their imagination go wild…

Over the years I have taken many photographs. Some of these are very close to my heart for various reasons. I love some for the people or places in them, others I love the story behind them.

I would like to share some of them here…


This slideshow requires JavaScript.

You can check out more of my photographs here.

My teaching philosophy

I have been fortunate in my school and university days to have been blessed with some wonderful teachers who have ignited in me a passion for the subject I now study and teach. They have cultivated and encouraged in me a holistic view of education. For me, a university education is not just about getting a degree but to gain knowledge. It is a place where you have new experiences both in and outside the classroom. You hope to find the niche where you excel and this is where your teachers play a very pivotal role.

A university education, no doubt, plays a crucial role in teaching skills and imparting knowledge in the relevant field. It prepares a person for a future role in the workforce. But this is not the only job a university education plays. It also produces the next generation of scientists, artists, teachers, etc.  Thus as a university lecturer, one has to balance the varied expectations of the many students. I aim towards being a lecturer who at most times can help each kind of student achieve their personal goal and stay committed to my goal of sharing knowledge and learning. With the advancement in technology, it has become easier to gain access to excellent information. Many wrongly feel that access to information is same as learning or gaining that knowledge. One still needs an expert in that field to impart that knowledge in a meaningful and insightful manner. I constantly work and aim towards reaching that goal.

My personal belief is that a student must work towards excellence in their chosen field and not run after material success. Success, I believe, is nothing but a by-product of excellence. Thus the role of a university teacher is to offer an environment where one can work towards that excellence. I teach in an applied field where the easy way is to teach the student a skill without worrying too much about the process behind the skill. An average student is also very happy to learn that skill which will eventually help him/her in the workforce. But without learning the process the skill will only take you up to a certain point and not beyond. I aim to take the extra step necessary, which will not just teach them the skill but appreciate how, why and where it works.

Nikon Nikkormat FT

I love photography. My interest in photography has transferred from my father. He had this wonderful camera he received as his wedding gift.

It was a Nikon Nikkormat FT series which he received in the early 1980s.

The Nikkormat FT has a full metal body which feels great in your hands. As a young kid, I relished each time my father would allow me to take some photographs with that camera. I was too young and naïve then, to understand the nuances of photography but that camera had left its mark. I was going to return to it later in life.

I rediscovered the photography bug in me in my early 20s with the help and guidance of a very close friend of mine. The Nikkormat which was not in much use then was still as sturdy and still worked like a charm. It had been over 2 decades since that camera was built. The light meter had stopped working but you could not fault it for anything else.

I used it in quite regularly in the early 2000s. I was trying to learn how to take good portraits. I must admit I am what you would call an amateur, I still am and would be a proud amateur forever. I would have loved to take photographs in B&W but did not have the resources to do so and had to be happy with colour films. But it was a good learning experience.

Then I moved to Australia got busy in other things and had to leave the Nikkormat back home. Fast forward to 2014; Finally, the Nikkormat has found its way back to my hands. The camera is over 30 years old now. It shows some ageing but it still works. I marvel at the excellence in the manufacturing process of the 70s and 80s. I believe they do not make cameras these days that last a lifetime.

In the last few years, I have started making pictures more regularly with a newer digital version of the Nikon SLR camera. But having the old camera back in my hands is like going around a full circle.

I would someday like to take some photographs with the Nikkormat but having it with me is a constant encouragement to make more pictures.

You can check out more of my photographs here.

My experience with education in India

I have been blessed with some wonderful teachers over the years. They have ignited in me a passion for the subject I now study and teach. If it were not for these truly inspiring figures in my life I would have a very different life.

Almost anyone who has studied the sciences in India knows that the way sciences are taught in India makes it very difficult to continue your love affair with the subject. Throughout school, the focus is on getting ‘good marks’ so you can get into a ‘good’ university. When you reach the university level you strive to get ‘good’ marks so you can get a good job and so it goes on like that. Somewhere on that journey, you forget why you undertook the journey, ‘to learn something’.

According to me, the purpose of education, whether it is in school or at university, is to gain knowledge. Sadly in India, the assessment does not reflect the learning you have attained. There is at most times a great disconnect what you learn and what you are tested on. My schools were not much different but along the way I found some teachers to guide my learning which made me the person I am today.

I would not comment on how it is worldwide but the current state of Indian education is that it stymies true learning. There is rigour in our education system and it does produce some great minds but unfortunately, it does not produce many original thinkers. Many would argue that some of the most successful people, in sciences, arts or business are Indians. And they would be correct. But if you look more deeply you will see that most have completed their further education outside India and many have not even had formal education.

Eventually, in learning varied subjects you find your passion and you continue in that field to attain mastery. It can be that you are passionate about engineering, medicine, theatre or music. As long as you are passionate about something, you can put your heart and soul into it and attain great heights.

I feel a major reason for this is that we do not have many original and inspiring educators. Unfortunately, you do not come across too many teachers who inspire the young minds and enhance their potential. I was fortunate in that instant. I got some wonderful teachers along the way. They taught me to how to think originally and critically about my subject.

I also had some wonderful parents who did not want me to take up a specific career because it would be the ‘right’ thing to do. They allowed me to study mathematics in university knowing full well that it was not a traditional field of study one chose in India. In conventional wisdom, these subjects do not lead to what is called ‘successful’ careers. But if I can echo one of the characters from a popular Indian film,

Do not chase success, as you will fail. But if you chase excellence then success will follow you.

I came here to the Australian National University to further my learning in Statistics and Actuarial Studies. I also teach the same subject in my department. I am still learning to be a better teacher every day but my goal is to be as inspiring as my teachers.

I try to instil the same passion I have for my subject in my teaching style.

I know that as long as I am not excited about the subject I teach, my students will never get excited about it.

This is where it all started

I completed my BSc in Mathematics from Jadavpur University in Kolkata, India. I had a great time there learning and deepening my love for mathematics and statistics. As I was nearing completion one thing had become clear that my interest was more in the applied field and not the theoretical (dare I say, ‘purer’)  form of mathematics.

Actuarial studies seemed like a great choice at that time. It also gave me the opportunity to venture out of my hometown and I decided to apply to universities in Australia. ANU was my favourite even before I got accepted here. Something about ANU and Canberra was drawing me towards it.

I was quite excited about the application process. In that excitement, I wrote an essay on why I wanted to study Actuarial Science and why ANU would be the best choice. Although such an essay was not required as part of the application process, I felt the need to get my passion for the subject across to whoever was going to decide my fate.

What follows is that essay I wrote for my application to ANU in late 2006.

I like Mathematics.

Mathematics is not just about ‘solving’ a problem and finding the ‘answer’. It is about comprehending the problem and then moving towards answers in a resourceful and elegant way. Understanding a situation thoroughly allows you to present not just one but many solutions and then pick the ideal one. Mathematics urges you to observe, examine, and extrapolate. It doesn’t just present you with predetermined set of rules but invites you to add to this set your own variations in a strict, considered, grammatical way. It does not restrict you to follow a single point of view but encourages you to create your own.

So it is not surprising that Mathematics is the global visa to the world of all professions, whether it is theoretical or applications based. Mathematics is particularly important in the study of cause and effect, choice, and optimization.

It is for this reason that I would like to be an Actuary.

Actuarial Sciences is an applied science. It deals with the real world. Its focus is on the practical and its benefits are for the public. Living in this world of risks and uncertainties is at times very difficult and confusing. An actuary strives to help an individual build a support system for oneself in order to provide security against such risks and uncertainties. The actuarial profession is about helping the community. An actuary strives to safeguard the interests of the public and help them to provide themselves a better standard of living.

Good human beings make good professionals.

This is what I believe: We are, each one of us, citizens of One World. I want to see this world, its many cultures, its many communities, and its many peoples. It is for this reason that I would like to travel far away to a distant nation and experience its distinct cultures and traditions. This experience will teach me to be more thoughtful, patient, faithful, and tolerant. It will make me a more considerate human being.

One never knows what the future holds. I would like my future to be that of a conscientious, hardworking, and dependable person.